Introduction to Chromaticity Diagrams and Color Gamuts
The X,Y,Z values (also called tristimulus values) are weights applied to the CIE primaries to match a color. Remember, that Y correlates approximately with brightness. With what then do X and Z correlate? The answer is that they do not correlate, even approximately, with any perceptual attributes. However, important color attributes are related to the relative magnitudes of the tristimulus values, called chromaticity coordinates, which are calculated as follows:
x = X / ( X + Y + Z )
y = Y / ( X + Y + Z )
z = Z / ( X + Y + Z ).
Clearly,
x + y + z = 1
and if x and y are known, it is easy to calculate z = 1 - x - y. With only two variables, such as x and y, it is possible to construct a two-dimentional diagram, or chromaticity diagram.
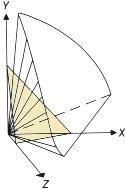
| This figure ([4]) shows the cone of visible colors in CIE XYZ color space. The X + Y + Z = 1 plane is shown as a triangle. The projection of the plane onto the (X,Y) plane forms the chromaticity diagram. |
| The curved line in the diagram shows where the color of the
spectrum lie and is called the spectral locus. The wavelengths along the curve
are indicated in nanometers. The line connecting the blue and red ends is called the purple boundary ([5]). Chromaticity values depend on only dominant wavelength and saturation, and are independent of the amount of luminous energy. For example, a brown color is not on the diagram; however, a brown is just a low-luminance orange-red. A standard white light (formally called illuminant C) is located near (but not at) x = y = z = 1/3. If two colors are represented by points C1 and C2, the additive mixture is a point C3, lying somewhere on the line C1C2. Complementary colors are those that can be mixed to produce white light. If a line is drawn from the white point through a point representing a specific color, the intersection of this line with the spectral locus defines the dominant wavelength. If the line crosses the purple boundary, the dominant wavelength cannot be defined, and such color is called nonspectral. Indeed, there is no magenta in the rainbow.
|
 |
The chromaticity diagram is also used to define color gamuts, or color ranges, that show the effect of adding colors together. Color gamuts are simple polygons positioned on the diagram. Because the Center of Gravity Law of color mixture holds for the diagram, all colors that are additive mixtures of the vertices of a gamut, are necessarily located inside the gamut. The horse-shoe shape of the diagram explains why visible red, green and blue cannot be mixed additively to match all colors. The diagram is thus useful to compare the gamuts of various color monitors, printers, slide films, and other hardcopy devices. Since usually the gamut of a printer is smaller than the one of a display, a reduced gamut of colors should be used with the display to achieve accurate reproduction.