Information on the RGB color space
The Applet:
General information on all the color space applets:
All the applets have a button at the top of the applet that says
"Click here for more information." Clicking the mouse on that
button will take you to a different document that is like this one,
that will give more information on that particular color space and
that particular applet.
All the applets also display some pictures that try to give the user
an idea of where in the color space they are, and what the particular
color space looks like.
They all have three slider bars near the bottom that control the
three parameters for the color space, though some also have other
controls to manipulate their parameters. To the right of each slider
bar is a label telling the name of the parameter (such as R for Red in
the RGB space, or L for Luminance in the CIE Luv space) as well as showing
the current value of this parameter.
There is a rectangle at the very bottom of the applet that shows
the color the current parameter values for the color space define.
Some applets also have an area for a message below this rectangle,
which will print out a message if the user generates a color in this
color space that is undisplayable on the monitor, because the RGB
translation of the current parameters gives one or more values
outside the proper RGB range [0,1].
If you choose to have more than 1 applet running (by picking more than
1 color space from the initial screen), then when one applet is modified,
the other applets modify themselves to show the same color. With this,
you can see better how different color spaces relate to one another.
I think it's very informative when having more than one applet running, to
put one or two of a color space's parameters at 0, and manipulate the other
to see how that specific parameter moves you around in this space and whatever
other space(s) you have running. For example, when running the RGB and CIE LUV
color space applets, moving the R, G, or B scroller of the RGB applet around, with
the other two set at 0 seems to give a decent impression of the shape of the
CIE LUV color space.
Specific information on this color space's applet:
The RGB (red, green, blue) parameters values all have the range [0,1].
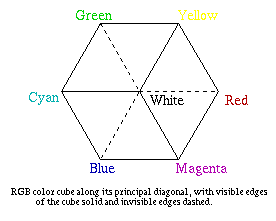 The topmost picture is a picture of the 3-dimensional RGB cube. It
shows the "hidden" lines as dotted, so the view is along the diagonal
of the cube, looking from the white (1,1,1) vertice down to the black
(0,0,0) vertice. As the user manipulates the values of the RGB parameters,
a blue dot moves along inside the cube, showing where in the cube the current
color's point lies.
The topmost picture is a picture of the 3-dimensional RGB cube. It
shows the "hidden" lines as dotted, so the view is along the diagonal
of the cube, looking from the white (1,1,1) vertice down to the black
(0,0,0) vertice. As the user manipulates the values of the RGB parameters,
a blue dot moves along inside the cube, showing where in the cube the current
color's point lies.
Below this picture are two "graphs" with color ramps in them. The one on
the left shows the Green axis as the vertical (y) axis, and the Red axis
as the horizontal (x) axis. The color ramp inside this graph shows the
appropriate colors of this graph when Blue = 0.0 (i.e. the back face
of the cube shown above it). The graph on the right shows the Red axis on
the vertical axis, and the Blue axis on the horizontal.
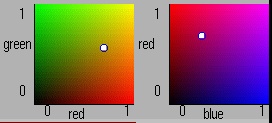 The color ramp inside
this graph shows the appropriate colors for when Green = 0.0 (i.e. it shows
what the bottom face of the cube above looks like). Inside these graphs is
a white dot (with a blue outline) that shows the values of the current RGB
parameters on the graph. If the user clicks the mouse (or drags it) inside
either graph, the appropriate RGB values will be adjusted to conform to where
the user clicks, so it is possible to maneuver in this color space using only
these graphs and not the slider bars.
The color ramp inside
this graph shows the appropriate colors for when Green = 0.0 (i.e. it shows
what the bottom face of the cube above looks like). Inside these graphs is
a white dot (with a blue outline) that shows the values of the current RGB
parameters on the graph. If the user clicks the mouse (or drags it) inside
either graph, the appropriate RGB values will be adjusted to conform to where
the user clicks, so it is possible to maneuver in this color space using only
these graphs and not the slider bars.
There are also the three standard (although colored in this applet) slider bars
that allow you to control the red (R), the green (G), and the blue (B)
components of the color displayed by the applet.
The RGB color space:
More Information:
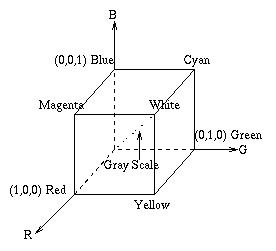 The RGB color model is made of three additive primaries Red, Green, and Blue. It is
the system used in almost all color CRT monitors, and is device-dependent (e.g. the
actual color displayed depends on what monitor you have, and what its settings are).
It is called additive, because the 3 different primaries are added together to produce
the desired color. The color model is shown as a Cartesian cube, with usually Red being
the x axis, Green being the y axis, and Blue being the z axis, as in the diagram to the
left. The diagonal from black (0,0,0) to white(1,1,1) is the gray scale, and is the
axis the user is looking down in the top picture of the RGB applet (shown above).
The RGB color model is made of three additive primaries Red, Green, and Blue. It is
the system used in almost all color CRT monitors, and is device-dependent (e.g. the
actual color displayed depends on what monitor you have, and what its settings are).
It is called additive, because the 3 different primaries are added together to produce
the desired color. The color model is shown as a Cartesian cube, with usually Red being
the x axis, Green being the y axis, and Blue being the z axis, as in the diagram to the
left. The diagonal from black (0,0,0) to white(1,1,1) is the gray scale, and is the
axis the user is looking down in the top picture of the RGB applet (shown above).
Links:
The Color Science & Technology
page in the U.K., with links to organizations and resources on color science.
An abstract on
using different color spaces to choose colors.
Here is a link to
a color space FAQ.
Back to the main color space applet page.